

Work with me: One-on-One Investment Coaching
Disclosure: Long BRK
Valuation Update
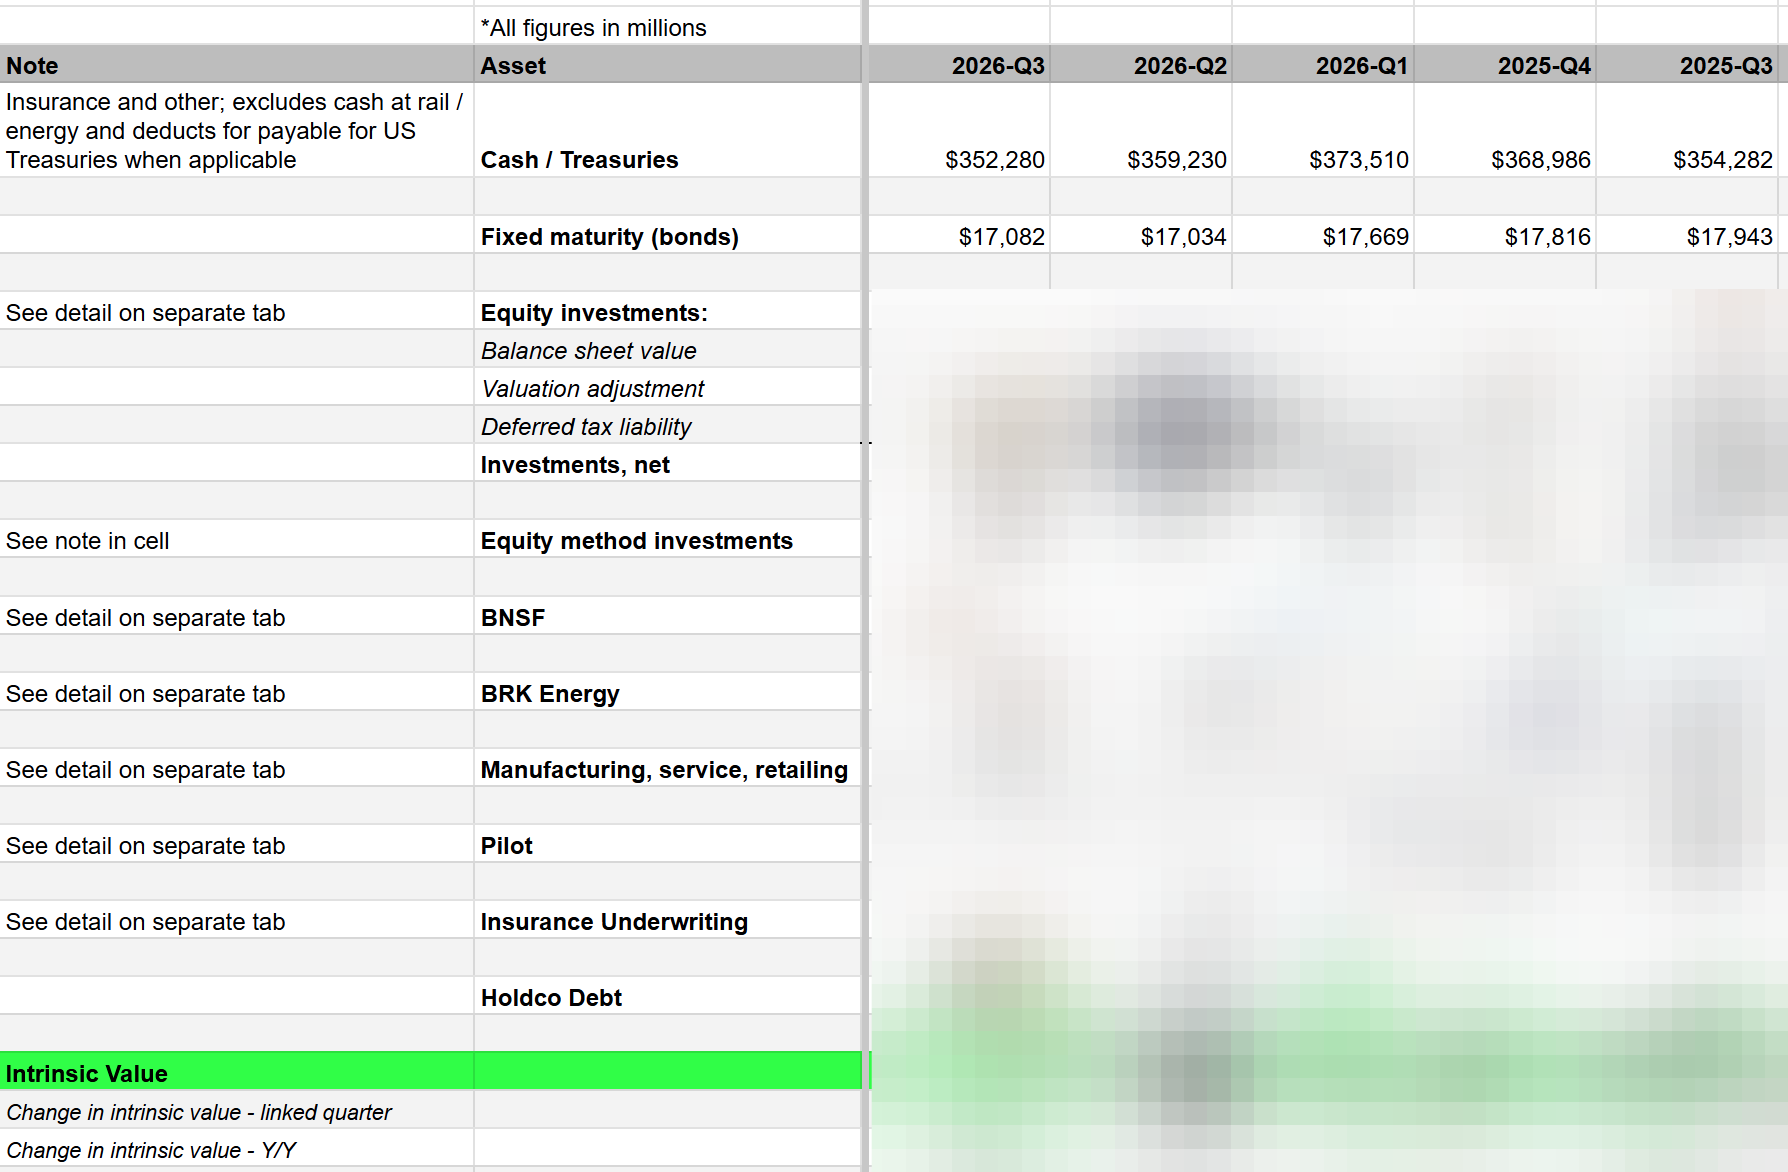
Subscribers can access the valuation model in Google Sheets, including a per-share valuation and earnings calculator.
High-Level Capital Allocation
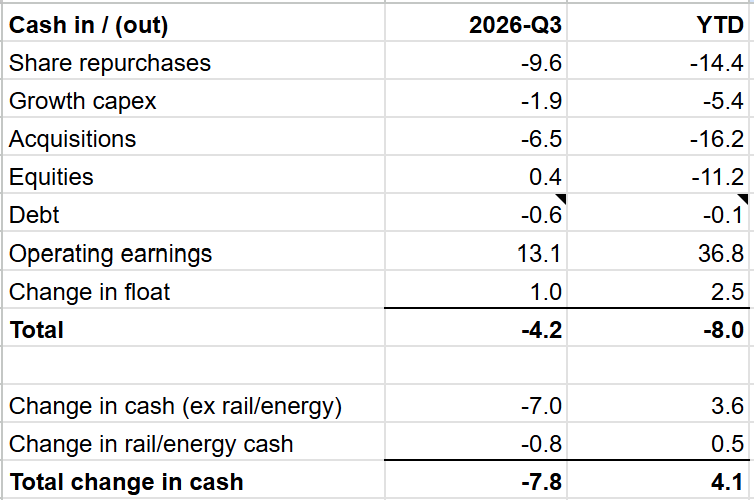
Share repurchases: $9.6 billion in Q3, bringing the YTD total to $14.4 billion. Berkshire paid a blended average of $502.69 per Class B share in Q3. The share count as of October 28, 2026 was 1,416,346, or 2,553 lower than the Q3 ending count, implying Berkshire bought back another $2 billion in October (assuming an average Class A price of $790,000).
Growth capex: $1.9 billion in Q3, bringing the YTD total to $5.4 billion. In both periods, about 80% went to BRK Energy, and ~12% to BNSF.
Acquisitions: $6.5 billion in Q3 and $16.2 billion YTD. Berkshire bought OxyChem in Q1 for $9.4 billion and homebuilder Taylor Morrison in Q3 for $6.8 billion (note: the acquisitions are gross while the cash flow statement is net of cash acquired).
Equity Portfolio: Berkshire bought $2.4 billion and sold $2.8 billion in Q3, for net sales of $0.4 billion. YTD Berkshire purchased $11.2 billion, net.
Debt: Combined debt increased $2.2 billion from Q2 to Q3, from additional borrowings in the insurance and other segment, which is primarily from Taylor Morrison. Actual cash borrowing was -$0.6 billion. YTD debt increased $1.7 billion to $131 billion.
Operating Earnings (adjusted for forex) came in at $13.05 billion, bringing the YTD total to $36.8 billion.
All told, $18 billion went out the door in Q3 for share repurchases, growth capex, and acquisitions. Operating earnings, net sales of equities, and change in float brought in $14.5 billion.
In short, Greg Abel has allocated more capital than operating earnings.
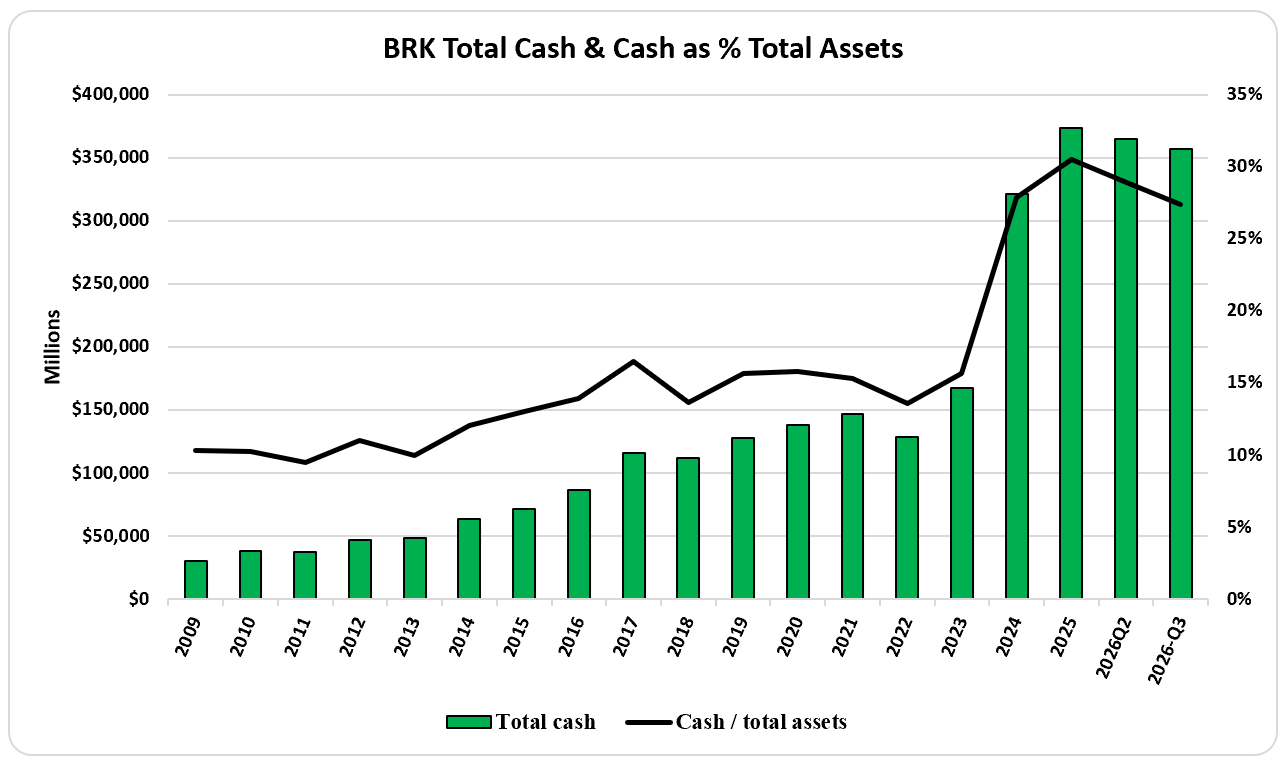
Berkshire’s total cash now sits at $357 billion, or 27% of total assets.
Now let’s turn to operating results and valuation…
